Cross Correlation ?
In signal processing, cross-correlation is a measure of similarity of two series as a function of the displacement of one relative to the other. This is also known as a sliding dot product or sliding inner-product. It is commonly used for searching a long signal for a shorter, known feature. It has applications in pattern recognition, single particle analysis, electron tomography, averaging, cryptanalysis, and neurophysiology.
source link
https://en.wikipedia.org/wiki/Cross-correlation
## Python code
test_crosscorrelation.py


--------------------------------------------------------
import numpy as np
import matplotlib.pyplot as plt
import math
# npts = 500
x = np.linspace(0, 50, 500)
npts = len(x)
y1 = 5 * np.sin(x/2) + np.random.randn(npts)
# y2 = 5 * np.cos(x/2) + np.random.randn(npts)
y2 = 5 * np.sin(x/2) + np.random.randn(npts)
def crocor(x,y):
npts = len(x)
lags = np.arange(-npts + 1, npts)
# Cross covariance
ccov = np.correlate((y1 - y1.mean()), y2 - y2.mean(), mode='full')
# Cross correlation coefficient
ccor = ccov / (y1.std() * y2.std() * npts)
return (ccor, lags)
# ################3
# Cross correlation coefficient by user defined function
# numpy.correlate (Cross correlate) calculates the similarity
# between two vectors/signals as a function of lag
# Seems it's wrong
pcc = np.correlate( (y1-y1.mean())/np.std(y1)/len(y1) , (y2-y2.mean())/np.std(y2) , mode='full')
# Plot
ccor, lags = crocor(y1,y2)
fig, axs = plt.subplots(nrows=3)
fig.subplots_adjust(hspace=0.4)
ax = axs[0]
ax.plot(x, y1, 'b', label='y1')
ax.plot(x, y2, 'r', label='y2')
ax.set_ylim(-10, 10)
ax.legend(loc='upper right', fontsize='small', ncol=2)
ax = axs[1]
ax.plot(lags, ccor)
ax.set_ylim(-1.1, 1.1)
ax.set_ylabel('cross-correlation')
ax.set_xlabel('lag of y1 relative to y2')
ax = axs[2]
ax.plot(lags,pcc)
maxlag = lags[np.argmax(ccor)]
# print("max correlation is at lag %d" % maxlag)
# print(np.argmax(ccor))
plt.show()
# ############################
# Cross correlation coefficient according to the formula
# In signal processing ,
# numpy.correlate (Cross correlate) calculates the similarity between two vectors/signals
# as a function of lag
aa = np.cov(y1,y2, bias=True) # Without the option 'bias=True', numpy.cov calculates the sample covariance
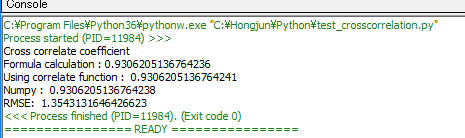
print('Cross correlate coefficient')
print('Formula calculation :', (aa[0][1]/(y1.std() * y2.std()) ))
print('Using correlate function : ', np.max(ccor))
print('Numpy : ', np.max(pcc))
# #######################
# Mean Square Error
# mse = ((y1-y2)**2).sum() / len(y1)
# # Root Mean Square Error
# rmse = math.sqrt(mse)
# print(mse)
# RMSE by numpy
print('RMSE: ' , np.sqrt(np.mean((y1-y2)**2)) )
## Python code
test_crosscorrelation.py

--------------------------------------------------------
import numpy as np
import matplotlib.pyplot as plt
import math
# npts = 500
x = np.linspace(0, 50, 500)
npts = len(x)
y1 = 5 * np.sin(x/2) + np.random.randn(npts)
# y2 = 5 * np.cos(x/2) + np.random.randn(npts)
y2 = 5 * np.sin(x/2) + np.random.randn(npts)
def crocor(x,y):
npts = len(x)
lags = np.arange(-npts + 1, npts)
# Cross covariance
ccov = np.correlate((y1 - y1.mean()), y2 - y2.mean(), mode='full')
# Cross correlation coefficient
ccor = ccov / (y1.std() * y2.std() * npts)
return (ccor, lags)
# ################3
# Cross correlation coefficient by user defined function
# numpy.correlate (Cross correlate) calculates the similarity
# between two vectors/signals as a function of lag
# Seems it's wrong
pcc = np.correlate( (y1-y1.mean())/np.std(y1)/len(y1) , (y2-y2.mean())/np.std(y2) , mode='full')
# Plot
ccor, lags = crocor(y1,y2)
fig, axs = plt.subplots(nrows=3)
fig.subplots_adjust(hspace=0.4)
ax = axs[0]
ax.plot(x, y1, 'b', label='y1')
ax.plot(x, y2, 'r', label='y2')
ax.set_ylim(-10, 10)
ax.legend(loc='upper right', fontsize='small', ncol=2)
ax = axs[1]
ax.plot(lags, ccor)
ax.set_ylim(-1.1, 1.1)
ax.set_ylabel('cross-correlation')
ax.set_xlabel('lag of y1 relative to y2')
ax = axs[2]
ax.plot(lags,pcc)
maxlag = lags[np.argmax(ccor)]
# print("max correlation is at lag %d" % maxlag)
# print(np.argmax(ccor))
plt.show()
# ############################
# Cross correlation coefficient according to the formula
# In signal processing ,
# numpy.correlate (Cross correlate) calculates the similarity between two vectors/signals
# as a function of lag
aa = np.cov(y1,y2, bias=True) # Without the option 'bias=True', numpy.cov calculates the sample covariance
print('Cross correlate coefficient')
print('Formula calculation :', (aa[0][1]/(y1.std() * y2.std()) ))
print('Using correlate function : ', np.max(ccor))
print('Numpy : ', np.max(pcc))
# #######################
# Mean Square Error
# mse = ((y1-y2)**2).sum() / len(y1)
# # Root Mean Square Error
# rmse = math.sqrt(mse)
# print(mse)
# RMSE by numpy
print('RMSE: ' , np.sqrt(np.mean((y1-y2)**2)) )
-------------------------------------------------------------------------------