Cross Correlation ?
In signal processing, cross-correlation is a measure of similarity of two series as a function of the displacement of one relative to the other. This is also known as a sliding dot product or sliding inner-product. It is commonly used for searching a long signal for a shorter, known feature. It has applications in pattern recognition, single particle analysis, electron tomography, averaging, cryptanalysis, and neurophysiology.
source link
https://en.wikipedia.org/wiki/Cross-correlation
## Python code
test_crosscorrelation.py


--------------------------------------------------------
import numpy as np
import matplotlib.pyplot as plt
import math
# npts = 500
x = np.linspace(0, 50, 500)
npts = len(x)
y1 = 5 * np.sin(x/2) + np.random.randn(npts)
# y2 = 5 * np.cos(x/2) + np.random.randn(npts)
y2 = 5 * np.sin(x/2) + np.random.randn(npts)
def crocor(x,y):
npts = len(x)
lags = np.arange(-npts + 1, npts)
# Cross covariance
ccov = np.correlate((y1 - y1.mean()), y2 - y2.mean(), mode='full')
# Cross correlation coefficient
ccor = ccov / (y1.std() * y2.std() * npts)
return (ccor, lags)
# ################3
# Cross correlation coefficient by user defined function
# numpy.correlate (Cross correlate) calculates the similarity
# between two vectors/signals as a function of lag
# Seems it's wrong
pcc = np.correlate( (y1-y1.mean())/np.std(y1)/len(y1) , (y2-y2.mean())/np.std(y2) , mode='full')
# Plot
ccor, lags = crocor(y1,y2)
fig, axs = plt.subplots(nrows=3)
fig.subplots_adjust(hspace=0.4)
ax = axs[0]
ax.plot(x, y1, 'b', label='y1')
ax.plot(x, y2, 'r', label='y2')
ax.set_ylim(-10, 10)
ax.legend(loc='upper right', fontsize='small', ncol=2)
ax = axs[1]
ax.plot(lags, ccor)
ax.set_ylim(-1.1, 1.1)
ax.set_ylabel('cross-correlation')
ax.set_xlabel('lag of y1 relative to y2')
ax = axs[2]
ax.plot(lags,pcc)
maxlag = lags[np.argmax(ccor)]
# print("max correlation is at lag %d" % maxlag)
# print(np.argmax(ccor))
plt.show()
# ############################
# Cross correlation coefficient according to the formula
# In signal processing ,
# numpy.correlate (Cross correlate) calculates the similarity between two vectors/signals
# as a function of lag
aa = np.cov(y1,y2, bias=True) # Without the option 'bias=True', numpy.cov calculates the sample covariance
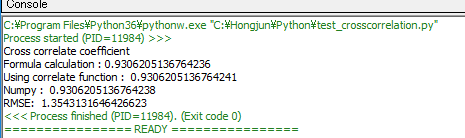
print('Cross correlate coefficient')
print('Formula calculation :', (aa[0][1]/(y1.std() * y2.std()) ))
print('Using correlate function : ', np.max(ccor))
print('Numpy : ', np.max(pcc))
# #######################
# Mean Square Error
# mse = ((y1-y2)**2).sum() / len(y1)
# # Root Mean Square Error
# rmse = math.sqrt(mse)
# print(mse)
# RMSE by numpy
print('RMSE: ' , np.sqrt(np.mean((y1-y2)**2)) )
## Python code
test_crosscorrelation.py

--------------------------------------------------------
import numpy as np
import matplotlib.pyplot as plt
import math
# npts = 500
x = np.linspace(0, 50, 500)
npts = len(x)
y1 = 5 * np.sin(x/2) + np.random.randn(npts)
# y2 = 5 * np.cos(x/2) + np.random.randn(npts)
y2 = 5 * np.sin(x/2) + np.random.randn(npts)
def crocor(x,y):
npts = len(x)
lags = np.arange(-npts + 1, npts)
# Cross covariance
ccov = np.correlate((y1 - y1.mean()), y2 - y2.mean(), mode='full')
# Cross correlation coefficient
ccor = ccov / (y1.std() * y2.std() * npts)
return (ccor, lags)
# ################3
# Cross correlation coefficient by user defined function
# numpy.correlate (Cross correlate) calculates the similarity
# between two vectors/signals as a function of lag
# Seems it's wrong
pcc = np.correlate( (y1-y1.mean())/np.std(y1)/len(y1) , (y2-y2.mean())/np.std(y2) , mode='full')
# Plot
ccor, lags = crocor(y1,y2)
fig, axs = plt.subplots(nrows=3)
fig.subplots_adjust(hspace=0.4)
ax = axs[0]
ax.plot(x, y1, 'b', label='y1')
ax.plot(x, y2, 'r', label='y2')
ax.set_ylim(-10, 10)
ax.legend(loc='upper right', fontsize='small', ncol=2)
ax = axs[1]
ax.plot(lags, ccor)
ax.set_ylim(-1.1, 1.1)
ax.set_ylabel('cross-correlation')
ax.set_xlabel('lag of y1 relative to y2')
ax = axs[2]
ax.plot(lags,pcc)
maxlag = lags[np.argmax(ccor)]
# print("max correlation is at lag %d" % maxlag)
# print(np.argmax(ccor))
plt.show()
# ############################
# Cross correlation coefficient according to the formula
# In signal processing ,
# numpy.correlate (Cross correlate) calculates the similarity between two vectors/signals
# as a function of lag
aa = np.cov(y1,y2, bias=True) # Without the option 'bias=True', numpy.cov calculates the sample covariance
print('Cross correlate coefficient')
print('Formula calculation :', (aa[0][1]/(y1.std() * y2.std()) ))
print('Using correlate function : ', np.max(ccor))
print('Numpy : ', np.max(pcc))
# #######################
# Mean Square Error
# mse = ((y1-y2)**2).sum() / len(y1)
# # Root Mean Square Error
# rmse = math.sqrt(mse)
# print(mse)
# RMSE by numpy
print('RMSE: ' , np.sqrt(np.mean((y1-y2)**2)) )
-------------------------------------------------------------------------------

Cross Correlation is a mathematical technique used to measure the similarity between two signals by comparing one signal with another at different time shifts. In Python 3, NumPy provides the correlate() function to calculate cross-correlation between two one-dimensional arrays. It is commonly used in signal processing, image processing, pattern recognition, time-series analysis, and machine learning.Numpy Course. The function supports three modes: full, which returns the complete correlation, same, which returns an output with the same size as the first input, and valid, which returns only the results without zero-padding effects. Cross-correlation helps identify similarities, detect patterns, and find time delays between signals.
ReplyDelete